In this example we’ll see how to run two different batches and then load and compare their results.
WARNING: running this vignette will likely take a long time, like 7 hours.
set.seed(42)

library(shellfishrisks) # now load shellfishrisks after installing required python packages
# If you get an error about a missing Python package, restart R completely, and then follow "Installing Python Packages" instructions

shellfishrisks::load_shellfish()
#> shellfishrisks is using Conda environment r-reticulate

# Set options

reps <- 1

coreid <- 1

# All the _years should ideally be set to 50. However, that takes >24 hours to run. For testing, we recommend setting years to 1 to ensure the installation is working properly.
pre_farm_years <- 5

farm_years <- 5

post_farm_years <- 5
# Run shellfishrisk model: this takes about 20min with these
# demonstration settings
shellfishrisk(
  batch = "spam1",
  reps = reps,
  coreid = coreid,
  pre_farm_years = pre_farm_years,
  farm_years = farm_years,
  post_farm_years = post_farm_years,
  wild_N_init = 100,
  seed_batch_size = 50
)

shellfishrisk(
  batch = "eggs2",
  reps = reps,
  coreid = coreid,
  pre_farm_years = pre_farm_years,
  farm_years = farm_years,
  post_farm_years = post_farm_years,
  wild_N_init = 200,
  seed_batch_size = 100
)
results <- serve_shellfish(batches = c("spam1","eggs2"),
                           results_dir = here::here("vignettes","results")) # read the results stored in .txt files into a list object

results$survival
#> # A tibble: 22 × 6
#> # Groups:   batch, coreid, Rep [2]
#>    batch coreid   Rep   age survival survivorship
#>    <chr>  <int> <int> <dbl>    <dbl>        <dbl>
#>  1 eggs2      1     0     0   0.743        1
#>  2 eggs2      1     0     1   0.740        0.743
#>  3 eggs2      1     0     2   0.707        0.550
#>  4 eggs2      1     0     3   0.732        0.389
#>  5 eggs2      1     0     4   0.725        0.284
#>  6 eggs2      1     0     5   0.720        0.206
#>  7 eggs2      1     0     6   0.715        0.148
#>  8 eggs2      1     0     7   0.699        0.106
#>  9 eggs2      1     0     8   0.697        0.0743
#> 10 eggs2      1     0     9   0.0371       0.0518
#> # … with 12 more rows

plot_shellfish(results, type = "rvars")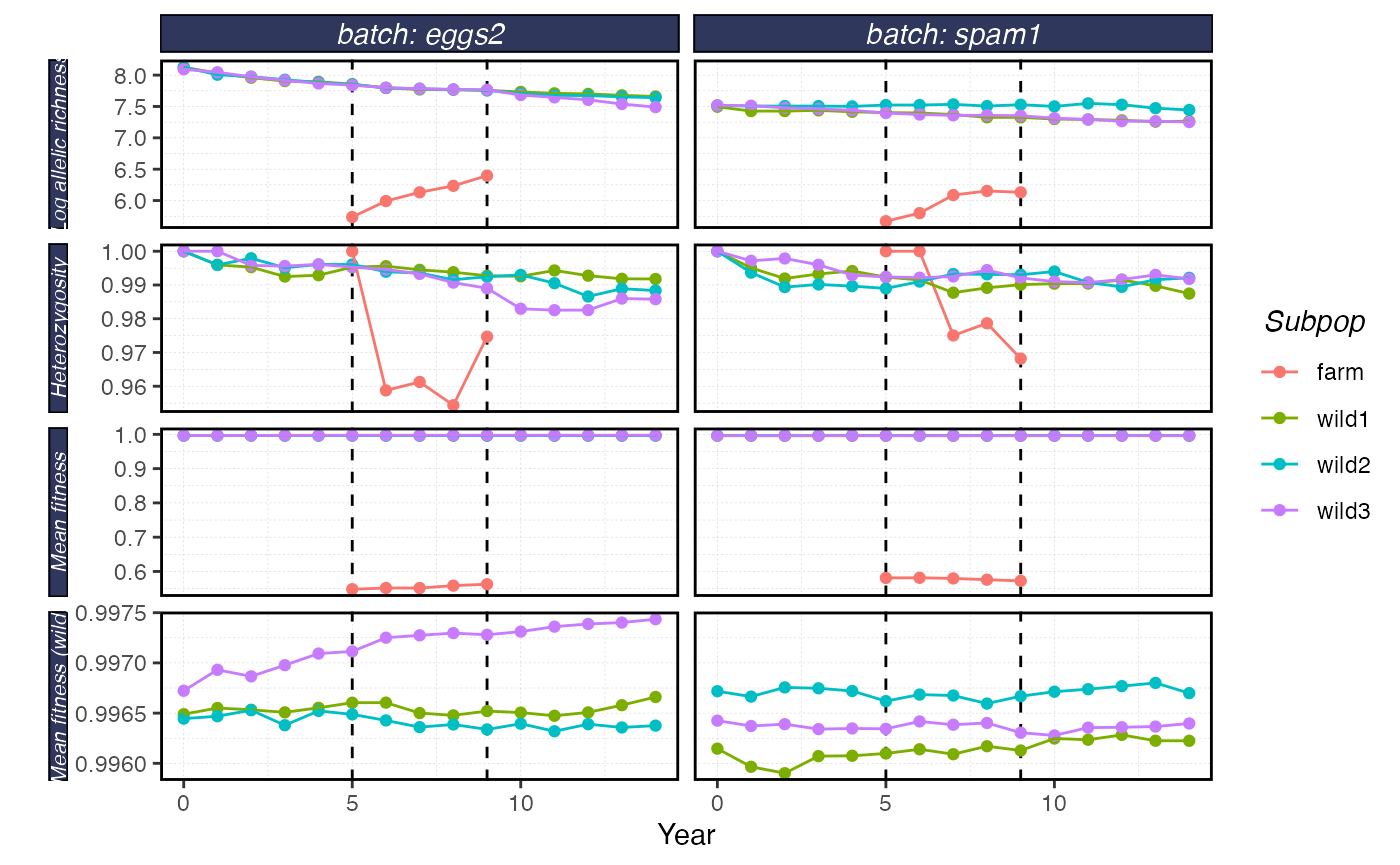
plot_shellfish(results, type = "fst")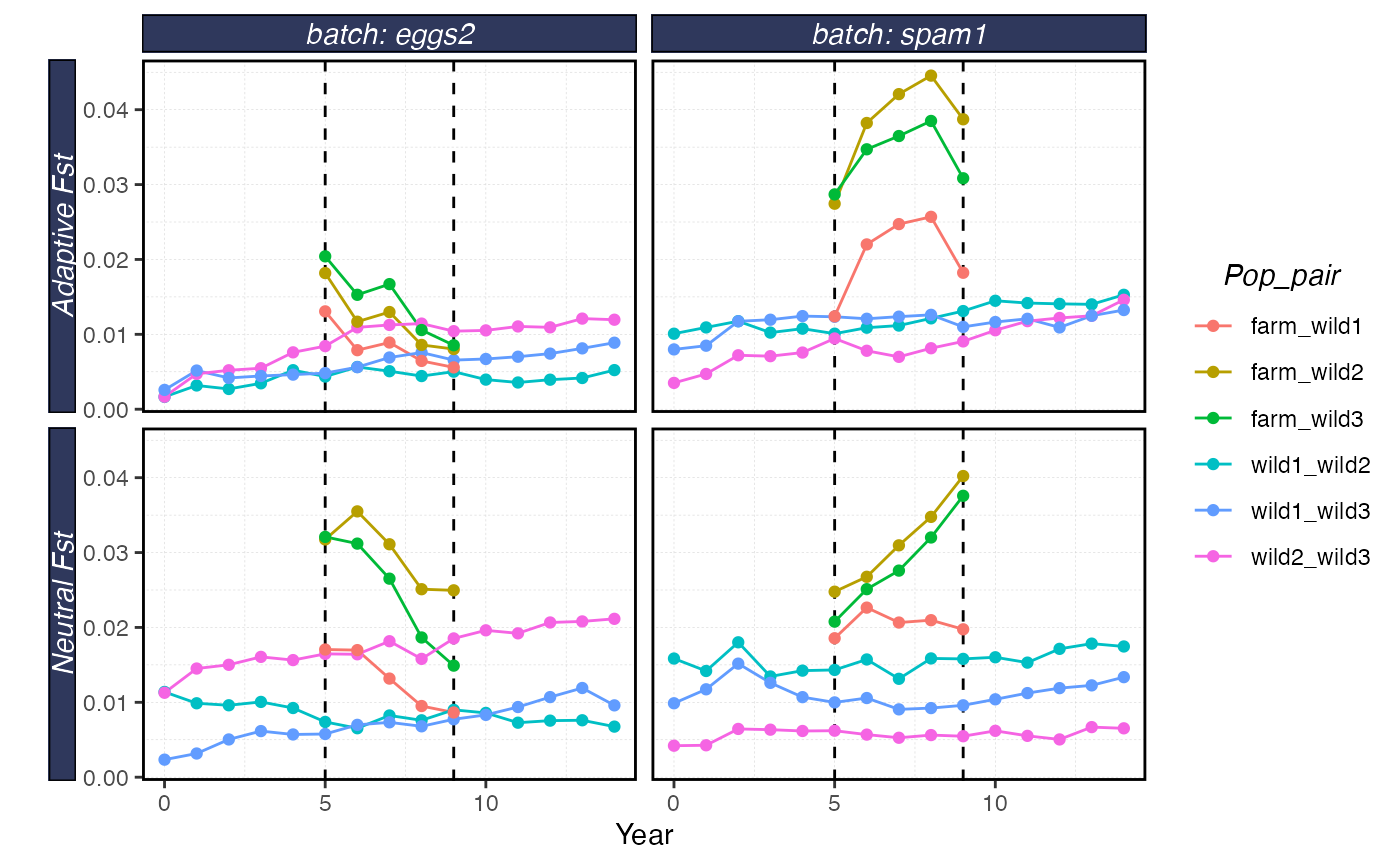
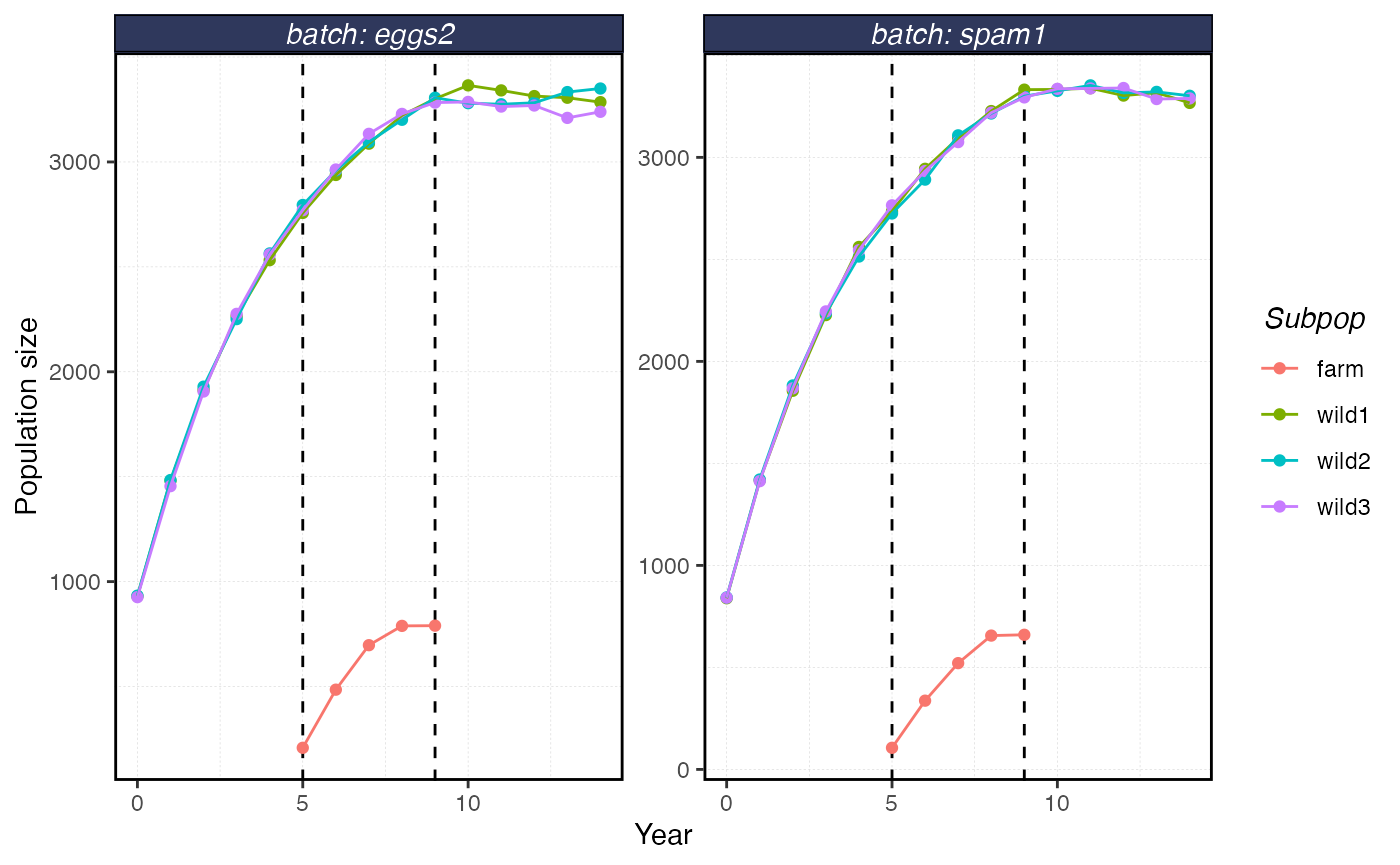
plot_shellfish(results, type = "popsize")