library(shellfishrisks)

load_shellfish()
#> shellfishrisks is using Conda environment r-reticulate

batch <- "ctrl_demo_2"
First, we’ll generate a control file with the default settings. This copies a .csv file named in this case “ctrl_file.csv” to your working directory. You could then open that file up and modify as you see fit.
ctrl_file_path <- generate_ctrl_file("ctrl_file")We’ll then run the shellfishrisk model using the settings in that control file. This will store the results in a folder called “results/{batch}”. A copy of the control file used to create that run will be stored in “results/{batch}” as well.
run_shellfishrisk_ctrlfile(batch = batch, reps = 1, ctrl_file_path = ctrl_file_path)And from there we can load and plot our results same as always.
results <- serve_shellfish(batches = batch) # read the results stored in .txt files into a list object

results$survival
#> # A tibble: 11 × 6
#> # Groups:   batch, coreid, Rep [1]
#>    batch       coreid   Rep   age survival survivorship
#>    <chr>        <int> <int> <dbl>    <dbl>        <dbl>
#>  1 ctrl_demo_2      1     0     0   0.536      1
#>  2 ctrl_demo_2      1     0     1   0.393      0.536
#>  3 ctrl_demo_2      1     0     2   0.0429     0.211
#>  4 ctrl_demo_2      1     0     3   0.841      0.00903
#>  5 ctrl_demo_2      1     0     4   0.702      0.00759
#>  6 ctrl_demo_2      1     0     5   0.633      0.00533
#>  7 ctrl_demo_2      1     0     6   0.642      0.00338
#>  8 ctrl_demo_2      1     0     7   0.644      0.00217
#>  9 ctrl_demo_2      1     0     8   0.685      0.00140
#> 10 ctrl_demo_2      1     0     9   0.205      0.000957
#> 11 ctrl_demo_2      1     0    10   0          0.000196

plot_shellfish(results, type = "rvars")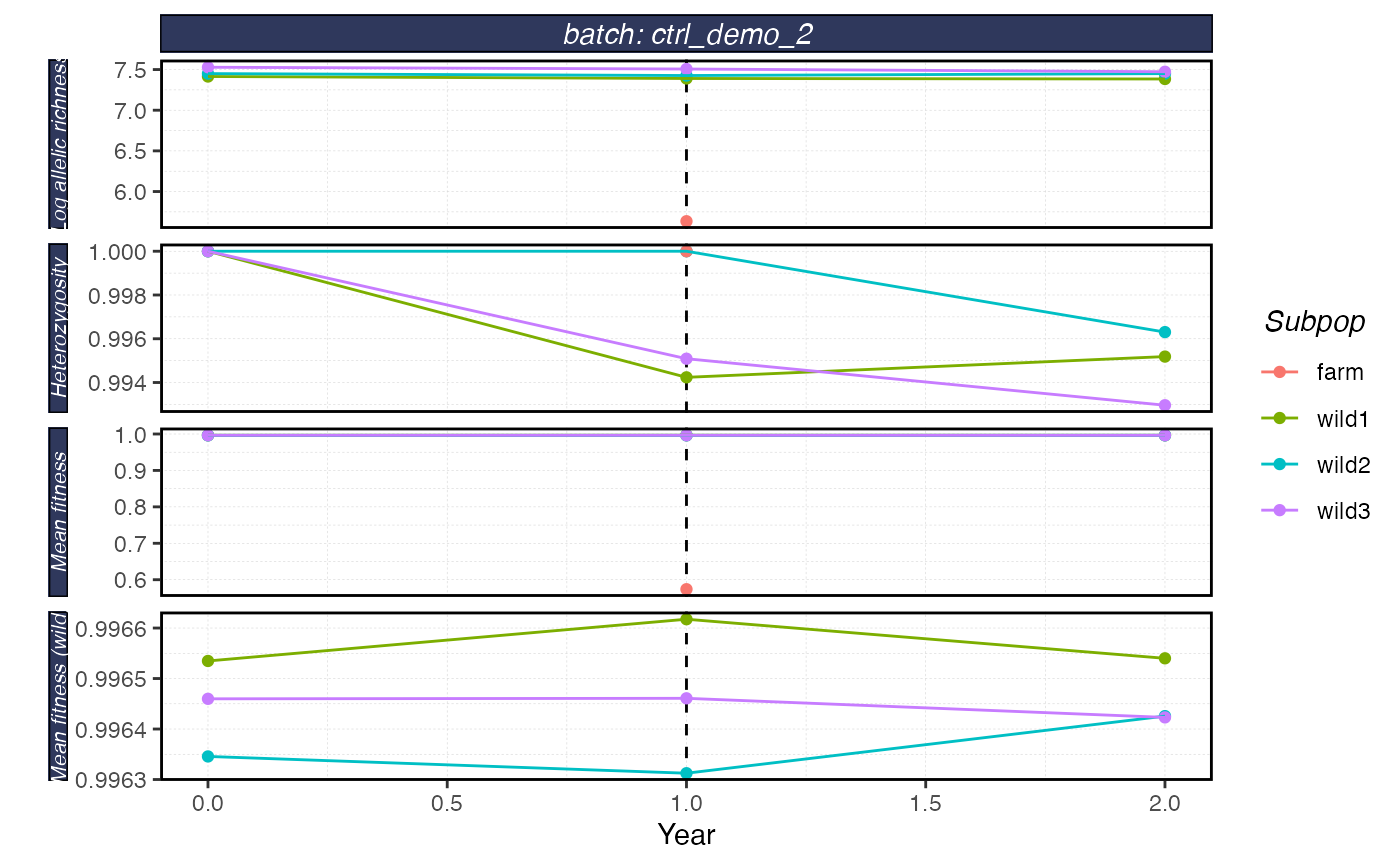
plot_shellfish(results, type = "fst")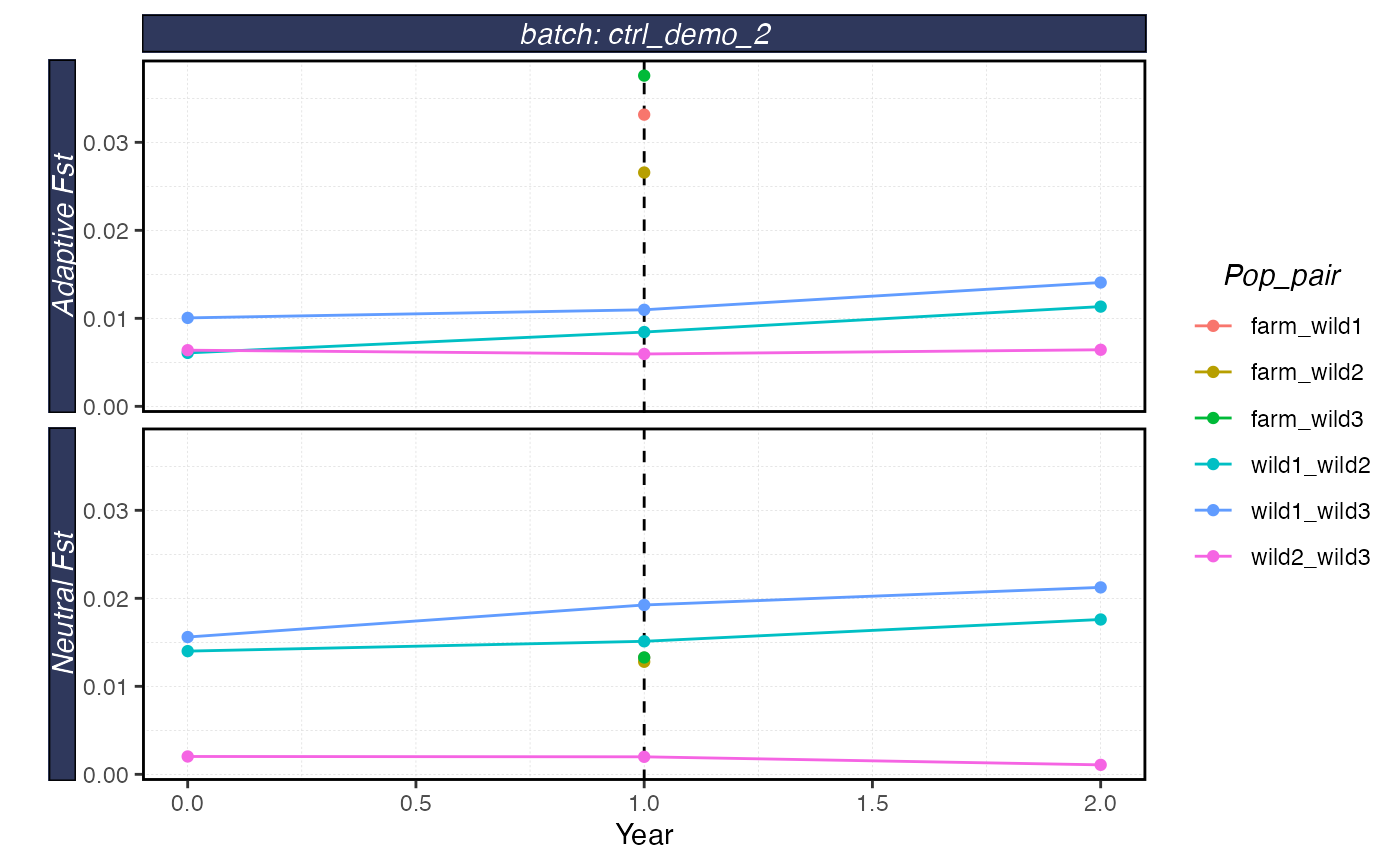
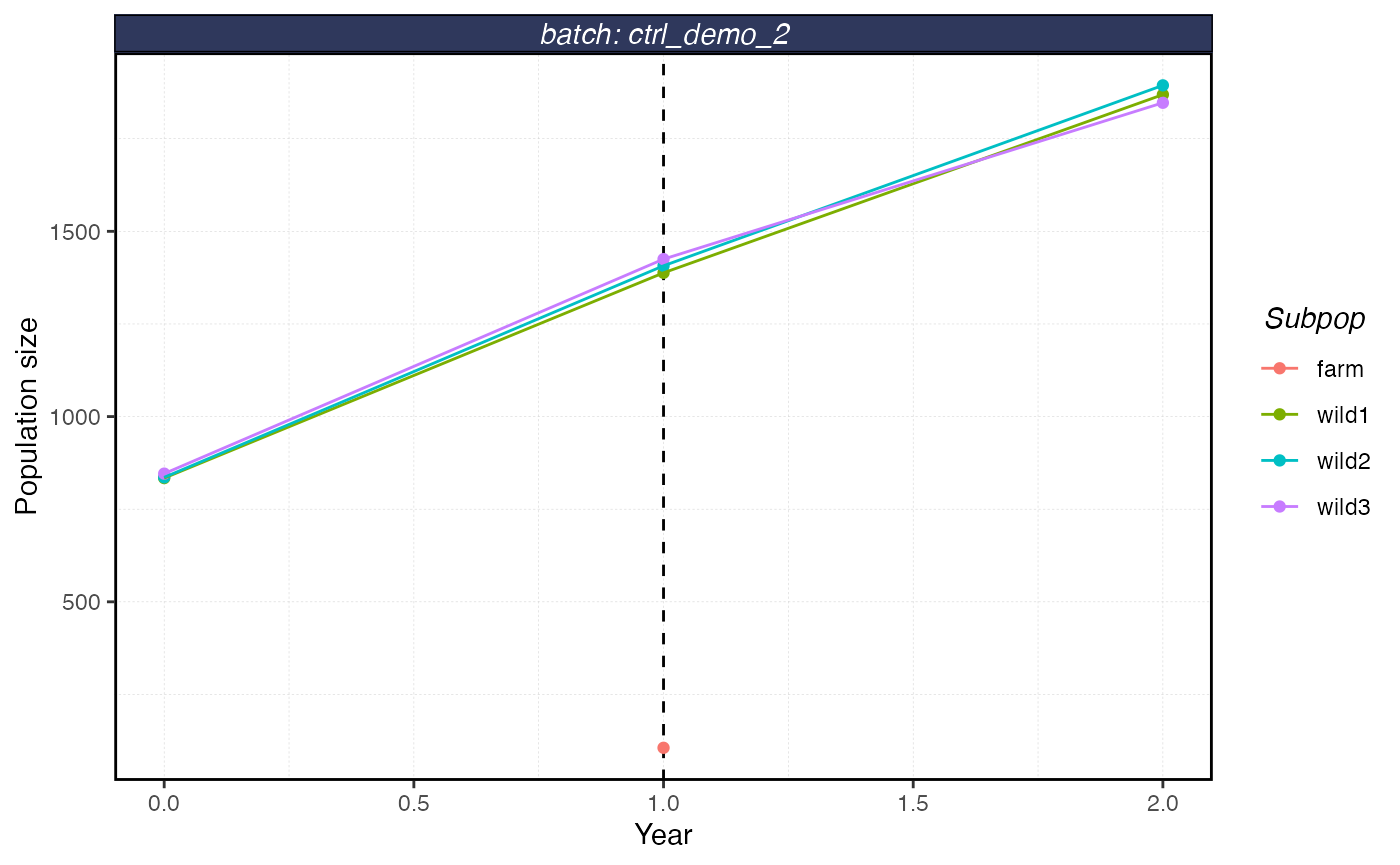
plot_shellfish(results, type = "popsize")